 Web Server Statistics for visit.papua.click
Program started on Tue, Apr 30 2024 at 12:07 PM.
Analyzed requests from Tue, Dec 19 2023 at 4:23 AM to Tue, Apr 30 2024 at 10:39 AM (133.26 days).
Web Server Statistics for visit.papua.clickProgram started on Tue, Apr 30 2024 at 12:07 PM.
Analyzed requests from Tue, Dec 19 2023 at 4:23 AM to Tue, Apr 30 2024 at 10:39 AM (133.26 days).
(Go To: Top | General Summary | Monthly Report | Daily Summary | Hourly Summary | Domain Report | Organization Report | Redirected Referrer Report | Browser Report | Browser Summary | Operating System Report | Status Code Report | File Size Report | File Type Report | Directory Report | Request Report)
Figures in parentheses refer to the 7-day period ending Apr 30 2024 at 12:07 PM.
Successful requests: 38 (0)
Successful requests for pages: 10 (0)
Failed requests: 41 (0)
Redirected requests: 4,470 (22)
Distinct files requested: 14 (2,115)
Distinct hosts served: 24 (1,010)
Data transferred: 7.11 kilobytes (0 bytes)
Average data transferred per day: 54 bytes (0 bytes)
(Go To: Top | General Summary | Monthly Report | Daily Summary | Hourly Summary | Domain Report | Organization Report | Redirected Referrer Report | Browser Report | Browser Summary | Operating System Report | Status Code Report | File Size Report | File Type Report | Directory Report | Request Report)
Each unit ( ) represents 1 request for a page.
| month | #reqs | #pages | |
|---|---|---|---|
| Dec 2023 | 18 | 10 |   |
| Jan 2024 | 0 | 0 | |
| Feb 2024 | 8 | 0 | |
| Mar 2024 | 0 | 0 | |
| Apr 2024 | 12 | 0 |
Busiest month: Dec 2023 (10 requests for pages).
(Go To: Top | General Summary | Monthly Report | Daily Summary | Hourly Summary | Domain Report | Organization Report | Redirected Referrer Report | Browser Report | Browser Summary | Operating System Report | Status Code Report | File Size Report | File Type Report | Directory Report | Request Report)
Each unit () represents 1 request for a page.
| day | #reqs | #pages | |
|---|---|---|---|
| Sun | 8 | 0 | |
| Mon | 0 | 0 | |
| Tue | 18 | 10 | |
| Wed | 0 | 0 | |
| Thu | 0 | 0 | |
| Fri | 12 | 0 | |
| Sat | 0 | 0 |
(Go To: Top | General Summary | Monthly Report | Daily Summary | Hourly Summary | Domain Report | Organization Report | Redirected Referrer Report | Browser Report | Browser Summary | Operating System Report | Status Code Report | File Size Report | File Type Report | Directory Report | Request Report)
Each unit () represents 1 request for a page.
| hour | #reqs | #pages | |
|---|---|---|---|
| 0 | 0 | 0 | |
| 1 | 0 | 0 | |
| 2 | 0 | 0 | |
| 3 | 0 | 0 | |
| 4 | 18 | 10 | |
| 5 | 0 | 0 | |
| 6 | 0 | 0 | |
| 7 | 0 | 0 | |
| 8 | 0 | 0 | |
| 9 | 20 | 0 | |
| 10 | 0 | 0 | |
| 11 | 0 | 0 | |
| 12 | 0 | 0 | |
| 13 | 0 | 0 | |
| 14 | 0 | 0 | |
| 15 | 0 | 0 | |
| 16 | 0 | 0 | |
| 17 | 0 | 0 | |
| 18 | 0 | 0 | |
| 19 | 0 | 0 | |
| 20 | 0 | 0 | |
| 21 | 0 | 0 | |
| 22 | 0 | 0 | |
| 23 | 0 | 0 |
(Go To: Top | General Summary | Monthly Report | Daily Summary | Hourly Summary | Domain Report | Organization Report | Redirected Referrer Report | Browser Report | Browser Summary | Operating System Report | Status Code Report | File Size Report | File Type Report | Directory Report | Request Report)
Listing domains, sorted by the amount of traffic.
| #reqs | %bytes | domain |
|---|---|---|
| 38 | 100% | [unresolved numerical addresses] |
(Go To: Top | General Summary | Monthly Report | Daily Summary | Hourly Summary | Domain Report | Organization Report | Redirected Referrer Report | Browser Report | Browser Summary | Operating System Report | Status Code Report | File Size Report | File Type Report | Directory Report | Request Report)

Listing organizations, sorted by the number of requests.
| #reqs | %bytes | organization |
|---|---|---|
| 6 | 5.27% | 192.187 |
| 6 | 7.17% | 23 |
| 3 | 3.58% | 54 |
| 3 | 25.67% | 128.199 |
| 3 | 3.58% | 3 |
| 3 | 3.58% | 13 |
| 3 | 3.58% | 18 |
| 3 | 25.67% | 138.197 |
| 2 | 17.11% | 51 |
| 2 | 195.74 | |
| 2 | 2.39% | 35 |
| 1 | 1.19% | 16 |
| 1 | 1.19% | 34 |
(Go To: Top | General Summary | Monthly Report | Daily Summary | Hourly Summary | Domain Report | Organization Report | Redirected Referrer Report | Browser Report | Browser Summary | Operating System Report | Status Code Report | File Size Report | File Type Report | Directory Report | Request Report)
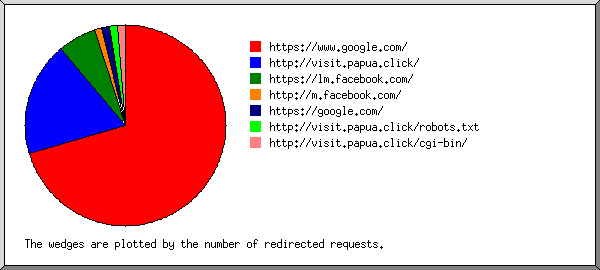
Listing referring URLs, sorted by the number of redirected requests.
(Go To: Top | General Summary | Monthly Report | Daily Summary | Hourly Summary | Domain Report | Organization Report | Redirected Referrer Report | Browser Report | Browser Summary | Operating System Report | Status Code Report | File Size Report | File Type Report | Directory Report | Request Report)

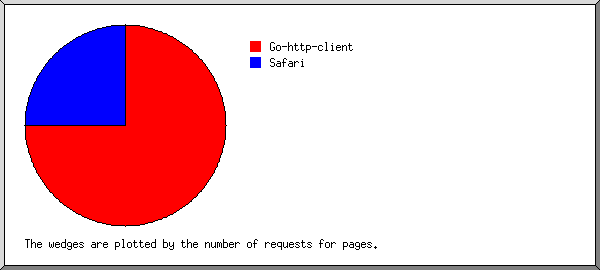
Listing browsers with at least 1 request for a page, sorted by the number of requests for pages.
| #reqs | #pages | browser |
|---|---|---|
| 6 | 6 | Go-http-client/1.1 |
| 2 | 2 | Mozilla/5.0 (Linux; Android 6.0; HTC One M9 Build/MRA512052) AppleWebKit/537.36 (KHTML, like Gecko) Chrome/52.0.3233.98 Mobile Safari/537.3 |
| 28 | 0 | [not listed: 2 browsers] |
(Go To: Top | General Summary | Monthly Report | Daily Summary | Hourly Summary | Domain Report | Organization Report | Redirected Referrer Report | Browser Report | Browser Summary | Operating System Report | Status Code Report | File Size Report | File Type Report | Directory Report | Request Report)
Listing browsers with at least 1 request for a page, sorted by the number of requests for pages.
| # | #reqs | #pages | browser |
|---|---|---|---|
| 1 | 6 | 6 | Go-http-client |
| 6 | 6 | Go-http-client/1 | |
| 2 | 2 | 2 | Safari |
| 2 | 2 | Safari/537 | |
| 28 | 0 | [not listed: 2 browsers] |
(Go To: Top | General Summary | Monthly Report | Daily Summary | Hourly Summary | Domain Report | Organization Report | Redirected Referrer Report | Browser Report | Browser Summary | Operating System Report | Status Code Report | File Size Report | File Type Report | Directory Report | Request Report)

Listing operating systems, sorted by the number of requests for pages.
| # | #reqs | #pages | OS |
|---|---|---|---|
| 1 | 34 | 6 | OS unknown |
| 2 | 2 | 2 | Unix |
| 2 | 2 | Linux |
(Go To: Top | General Summary | Monthly Report | Daily Summary | Hourly Summary | Domain Report | Organization Report | Redirected Referrer Report | Browser Report | Browser Summary | Operating System Report | Status Code Report | File Size Report | File Type Report | Directory Report | Request Report)
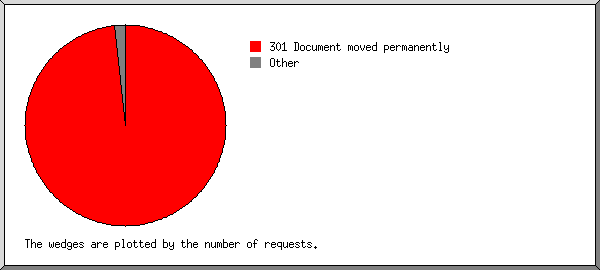
Listing status codes, sorted numerically.
| #reqs | status code |
|---|---|
| 38 | 200 OK |
| 4470 | 301 Document moved permanently |
| 41 | 404 Document not found |
(Go To: Top | General Summary | Monthly Report | Daily Summary | Hourly Summary | Domain Report | Organization Report | Redirected Referrer Report | Browser Report | Browser Summary | Operating System Report | Status Code Report | File Size Report | File Type Report | Directory Report | Request Report)
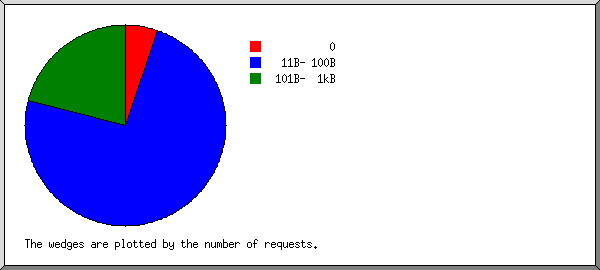
| size | #reqs | %bytes |
|---|---|---|
| 0 | 2 | |
| 1B- 10B | 0 | |
| 11B- 100B | 28 | 31.56% |
| 101B- 1kB | 8 | 68.44% |
(Go To: Top | General Summary | Monthly Report | Daily Summary | Hourly Summary | Domain Report | Organization Report | Redirected Referrer Report | Browser Report | Browser Summary | Operating System Report | Status Code Report | File Size Report | File Type Report | Directory Report | Request Report)
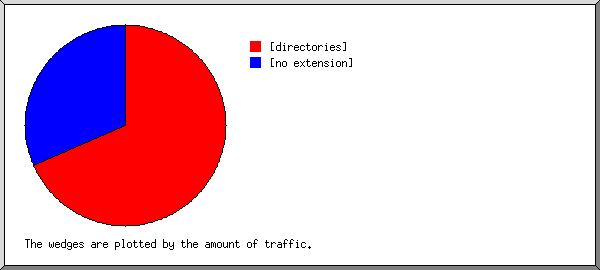
Listing extensions with at least 0.1% of the traffic, sorted by the amount of traffic.
| #reqs | %bytes | extension |
|---|---|---|
| 10 | 68.44% | [directories] |
| 28 | 31.56% | [no extension] |
(Go To: Top | General Summary | Monthly Report | Daily Summary | Hourly Summary | Domain Report | Organization Report | Redirected Referrer Report | Browser Report | Browser Summary | Operating System Report | Status Code Report | File Size Report | File Type Report | Directory Report | Request Report)

Listing directories with at least 0.01% of the traffic, sorted by the amount of traffic.
| #reqs | %bytes | directory |
|---|---|---|
| 10 | 68.44% | [root directory] |
| 28 | 31.56% | /.well-known/ |
(Go To: Top | General Summary | Monthly Report | Daily Summary | Hourly Summary | Domain Report | Organization Report | Redirected Referrer Report | Browser Report | Browser Summary | Operating System Report | Status Code Report | File Size Report | File Type Report | Directory Report | Request Report)
Listing files with at least 20 requests, sorted by the number of requests.
| #reqs | %bytes | last time | file |
|---|---|---|---|
| 38 | 100% | Apr/19/24 9:48 AM | [not listed: 13 files] |