Web Server Statistics for melanesia.melanesia.club

Program started on Fri, Feb 28 2025 at 12:11 PM.
Analyzed requests from Fri, Jan 05 2024 at 2:28 AM to Fri, Feb 28 2025 at 7:25 AM (420.21 days).

General Summary

(Go To: Top | General Summary | Monthly Report | Daily Summary | Hourly Summary | Domain Report | Organization Report | Redirected Referrer Report | Failed Referrer Report | Browser Report | Browser Summary | Operating System Report | Status Code Report | File Size Report | File Type Report | Directory Report | Request Report)

Figures in parentheses refer to the 7-day period ending Feb 28 2025 at 12:11 PM.

Successful requests: 582 (48)
Average successful requests per day: 1 (6)
Successful requests for pages: 287 (45)
Failed requests: 3,695 (53)
Redirected requests: 3,072 (2)
Distinct files requested: 308 (1,864)
Distinct hosts served: 50 (1,490)
Data transferred: 3.09 megabytes (272.86 kilobytes)
Average data transferred per day: 7.53 kilobytes (38.98 kilobytes)

Monthly Report

(Go To: Top | General Summary | Monthly Report | Daily Summary | Hourly Summary | Domain Report | Organization Report | Redirected Referrer Report | Failed Referrer Report | Browser Report | Browser Summary | Operating System Report | Status Code Report | File Size Report | File Type Report | Directory Report | Request Report)

Each unit (+) represents 3 requests for pages or part thereof.

month#reqs#pages 
Jan 202420
Feb 202410
Mar 202460
Apr 202400
May 202460
Jun 202400
Jul 202426093+++++++++++++++++++++++++++++++
Aug 2024191112++++++++++++++++++++++++++++++++++++++
Sep 202410
Oct 202454++
Nov 202482+
Dec 2024121+
    
Jan 202590
Feb 20258175+++++++++++++++++++++++++

Busiest month: Aug 2024 (112 requests for pages).

Daily Summary

(Go To: Top | General Summary | Monthly Report | Daily Summary | Hourly Summary | Domain Report | Organization Report | Redirected Referrer Report | Failed Referrer Report | Browser Report | Browser Summary | Operating System Report | Status Code Report | File Size Report | File Type Report | Directory Report | Request Report)

Each unit (+) represents 4 requests for pages or part thereof.

day#reqs#pages 
Sun11775+++++++++++++++++++
Mon2015++++
Tue4431++++++++
Wed375165++++++++++++++++++++++++++++++++++++++++++
Thu51+
Fri170
Sat40

Hourly Summary

(Go To: Top | General Summary | Monthly Report | Daily Summary | Hourly Summary | Domain Report | Organization Report | Redirected Referrer Report | Failed Referrer Report | Browser Report | Browser Summary | Operating System Report | Status Code Report | File Size Report | File Type Report | Directory Report | Request Report)

Each unit (+) represents 3 requests for pages or part thereof.

hour#reqs#pages 
01716++++++
130
230
32723++++++++
47234++++++++++++
500
640
720
820
921+
1010
112115+++++
1251+
1320
1421+
151715+++++
161716++++++
1700
1830
1914791+++++++++++++++++++++++++++++++
2021359++++++++++++++++++++
211815+++++
2200
2340

Domain Report

(Go To: Top | General Summary | Monthly Report | Daily Summary | Hourly Summary | Domain Report | Organization Report | Redirected Referrer Report | Failed Referrer Report | Browser Report | Browser Summary | Operating System Report | Status Code Report | File Size Report | File Type Report | Directory Report | Request Report)

Listing domains, sorted by the amount of traffic.

#reqs%bytesdomain
582100%[unresolved numerical addresses]

Organization Report

(Go To: Top | General Summary | Monthly Report | Daily Summary | Hourly Summary | Domain Report | Organization Report | Redirected Referrer Report | Failed Referrer Report | Browser Report | Browser Summary | Operating System Report | Status Code Report | File Size Report | File Type Report | Directory Report | Request Report)

Listing the top 20 organizations by the number of requests, sorted by the number of requests.

#reqs%bytesorganization
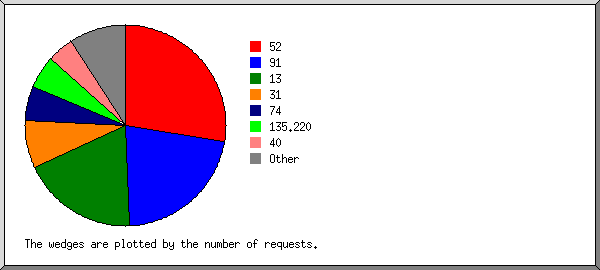
26330.01%91
11313.03%52
94 9.98%31
6311.54%13
10 7.49%165.22
4 3.72%128.199
3 8.10%173.249
3 0.04%104
3 172.172
2 9.31%185.81
2 0.08%38
2 188.166
1 159.89
1 0.04%156.146
1 165.227
1 0.04%146.70
1 198.199
1 0.03%107
1 139.59
1 157.230
12 6.56%[not listed: 12 organizations]

Redirected Referrer Report

(Go To: Top | General Summary | Monthly Report | Daily Summary | Hourly Summary | Domain Report | Organization Report | Redirected Referrer Report | Failed Referrer Report | Browser Report | Browser Summary | Operating System Report | Status Code Report | File Size Report | File Type Report | Directory Report | Request Report)

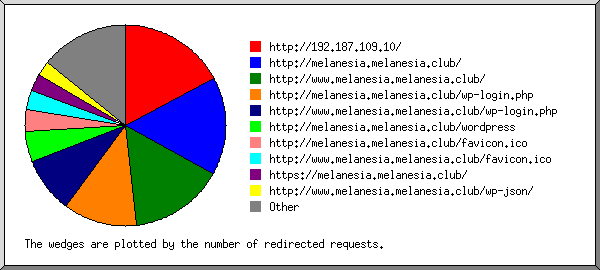
Listing the top 30 referring URLs by the number of redirected requests, sorted by the number of redirected requests.

#reqsURL
72http://melanesia.melanesia.club/wp-login.php
60http://192.187.109.10/
55http://www.melanesia.melanesia.club/wp-login.php
40http://melanesia.melanesia.club/
29http://melanesia.melanesia.club/wordpress
28http://www.melanesia.melanesia.club/
15http://www.melanesia.melanesia.club/wp-json/
14  http://www.melanesia.melanesia.club/wp-json/?rest_route=/wp/v2/USERS
6https://melanesia.melanesia.club/
5http://melanesia.melanesia.club/favicon.ico
4http://melanesia.melanesia.club/sitemap.xml
4http://melanesia.melanesia.club/robots.txt
3http://melanesia.melanesia.club/wp-json/
3https://www.melanesia.melanesia.club/
2http://melanesia.melanesia.club/.git/config
2http://www.google.com/
2http://www.melanesia.melanesia.club/.git/config
1https://a.s3.us-west-2.amazonaws.com/
1http://tarantuloff.ru/
1http://melanesia.melanesia.club/members/wp-login.php
1https://pytdzeoy.agnqgvgobrtcxel.work:12244/
1http://www.melanesia.melanesia.club/favicon.ico
1http://177.27.224.8:1024/
1http://melanesia.melanesia.club//.env
1http://89.213.157.231:2107/
1http://melanesia.melanesia.club/admin
1https://py.c5-latam.com/
1https://104.223.45.94:8443/
1http://melanesia.melanesia.club/index.php
1https://www.google.com/
1https://216.98.10.117:9981/
12[not listed: 12 URLs]

Failed Referrer Report

(Go To: Top | General Summary | Monthly Report | Daily Summary | Hourly Summary | Domain Report | Organization Report | Redirected Referrer Report | Failed Referrer Report | Browser Report | Browser Summary | Operating System Report | Status Code Report | File Size Report | File Type Report | Directory Report | Request Report)

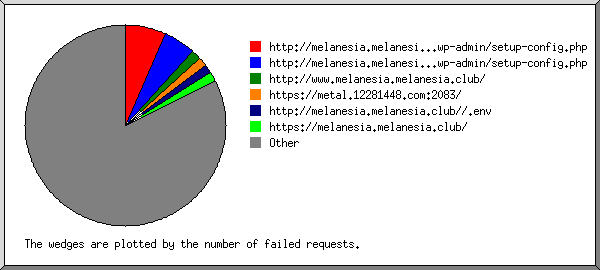
Listing referring URLs, sorted by the number of failed requests.

#reqsURL
5http://melanesia.melanesia.club/wp-admin/setup-config.php
4http://melanesia.melanesia.club/wordpress/wp-admin/setup-config.php
1http://www.melanesia.melanesia.club/

Browser Report

(Go To: Top | General Summary | Monthly Report | Daily Summary | Hourly Summary | Domain Report | Organization Report | Redirected Referrer Report | Failed Referrer Report | Browser Report | Browser Summary | Operating System Report | Status Code Report | File Size Report | File Type Report | Directory Report | Request Report)

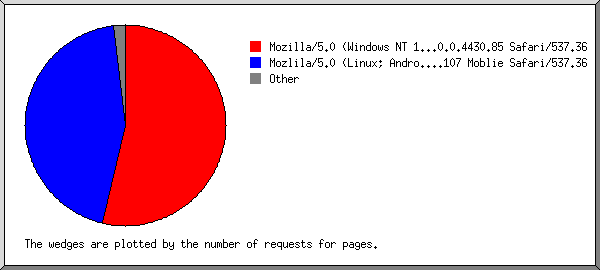
Listing browsers with at least 1 request for a page, sorted by the number of requests for pages.

#reqs#pagesbrowser
188112Mozilla/5.0 (Windows NT 10.0; Win64; x64) AppleWebKit/537.36 (KHTML, like Gecko) Chrome/90.0.4430.85 Safari/537.36
27493Mozlila/5.0 (Linux; Android 7.0; SM-G892A Bulid/NRD90M; wv) AppleWebKit/537.36 (KHTML, like Gecko) Version/4.0 Chrome/60.0.3112.107 Moblie Safari/537.36
11Mozilla/5.0 (Macintosh; Intel Mac OS X 10.15; rv:77.0) Gecko/20100101 Firefox/77.0
320[not listed: 11 browsers]

Browser Summary

(Go To: Top | General Summary | Monthly Report | Daily Summary | Hourly Summary | Domain Report | Organization Report | Redirected Referrer Report | Failed Referrer Report | Browser Report | Browser Summary | Operating System Report | Status Code Report | File Size Report | File Type Report | Directory Report | Request Report)

Listing browsers with at least 1 request for a page, sorted by the number of requests for pages.

##reqs#pagesbrowser
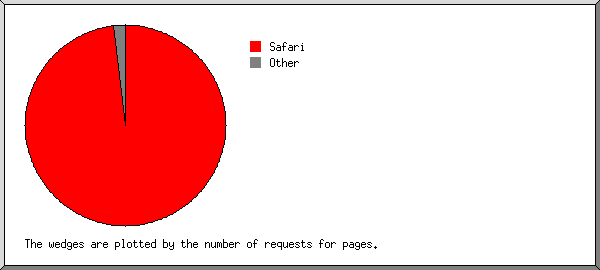
1475205Safari
 473205  Safari/537
211Firefox
 11  Firefox/77
 190[not listed: 3 browsers]

Operating System Report

(Go To: Top | General Summary | Monthly Report | Daily Summary | Hourly Summary | Domain Report | Organization Report | Redirected Referrer Report | Failed Referrer Report | Browser Report | Browser Summary | Operating System Report | Status Code Report | File Size Report | File Type Report | Directory Report | Request Report)

Listing operating systems, sorted by the number of requests for pages.

##reqs#pagesOS
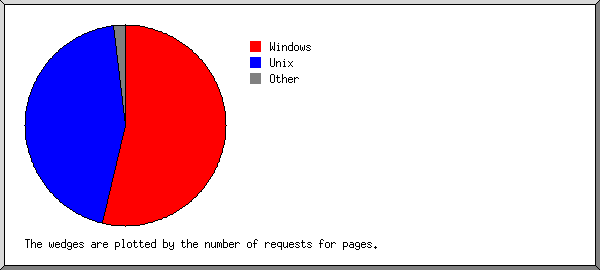
1197112Windows
 196112  Windows NT
 10  Unknown Windows
227693Unix
 27693  Linux
331Macintosh
4190OS unknown

Status Code Report

(Go To: Top | General Summary | Monthly Report | Daily Summary | Hourly Summary | Domain Report | Organization Report | Redirected Referrer Report | Failed Referrer Report | Browser Report | Browser Summary | Operating System Report | Status Code Report | File Size Report | File Type Report | Directory Report | Request Report)

Listing status codes, sorted numerically.

#reqsstatus code
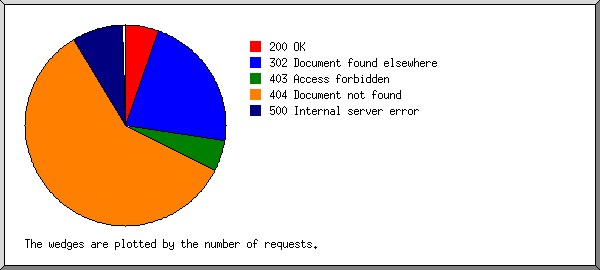
582200 OK
5301 Document moved permanently
3067302 Document found elsewhere
676403 Access forbidden
2160404 Document not found
32409 Request conflicts with state of resource
827500 Internal server error

File Size Report

(Go To: Top | General Summary | Monthly Report | Daily Summary | Hourly Summary | Domain Report | Organization Report | Redirected Referrer Report | Failed Referrer Report | Browser Report | Browser Summary | Operating System Report | Status Code Report | File Size Report | File Type Report | Directory Report | Request Report)

size#reqs%bytes
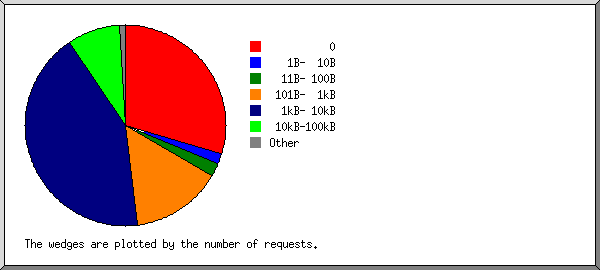
0246 
1B- 10B6 
11B- 100B15 0.03%
101B- 1kB80 2.01%
1kB- 10kB19317.70%
10kB-100kB3852.76%
100kB- 1MB427.51%

File Type Report

(Go To: Top | General Summary | Monthly Report | Daily Summary | Hourly Summary | Domain Report | Organization Report | Redirected Referrer Report | Failed Referrer Report | Browser Report | Browser Summary | Operating System Report | Status Code Report | File Size Report | File Type Report | Directory Report | Request Report)

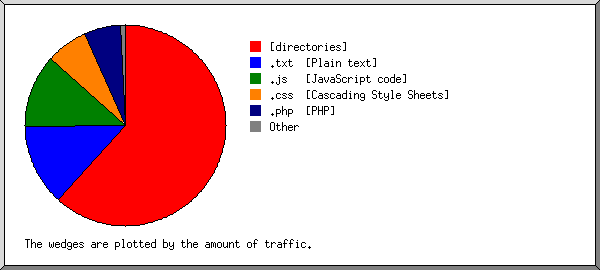
Listing extensions with at least 0.1% of the traffic, sorted by the amount of traffic.

#reqs%bytesextension
28747.76%[directories]
725.08%.js [JavaScript code]
25811.77%.php [PHP]
911.02%.css [Cascading Style Sheets]
18 3.67%.txt [Plain text]
1 0.44%.woff
1 0.23%.cgi [CGI scripts]
1 0.03%[not listed: 1 extension]

Directory Report

(Go To: Top | General Summary | Monthly Report | Daily Summary | Hourly Summary | Domain Report | Organization Report | Redirected Referrer Report | Failed Referrer Report | Browser Report | Browser Summary | Operating System Report | Status Code Report | File Size Report | File Type Report | Directory Report | Request Report)

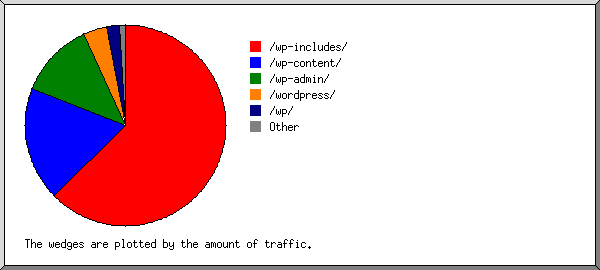
Listing directories with at least 0.01% of the traffic, sorted by the amount of traffic.

#reqs%bytesdirectory
45274.41%/wp-includes/
5710.88%/wp-content/
40 8.46%/wp-admin/
9 5.70%/wordpress/
10 0.29%/.well-known/
1 0.23%/cgi-sys/
13 0.02%[root directory]

Request Report

(Go To: Top | General Summary | Monthly Report | Daily Summary | Hourly Summary | Domain Report | Organization Report | Redirected Referrer Report | Failed Referrer Report | Browser Report | Browser Summary | Operating System Report | Status Code Report | File Size Report | File Type Report | Directory Report | Request Report)

Listing files with at least 20 requests, sorted by the number of requests.

#reqs%byteslast timefile
582100%Feb/28/25 1:12 AM[not listed: 301 files]